> library(RCytoscape)
> g <- new("graphNEL", edgemode = "directed")
> g <- graph::addNode("A", g)
> g <- graph::addNode("B", g)
> g <- graph::addNode("C", g)
> cw <- CytoscapeWindow("vignette", graph = g)
> ping(cw)
[1] "It works!"
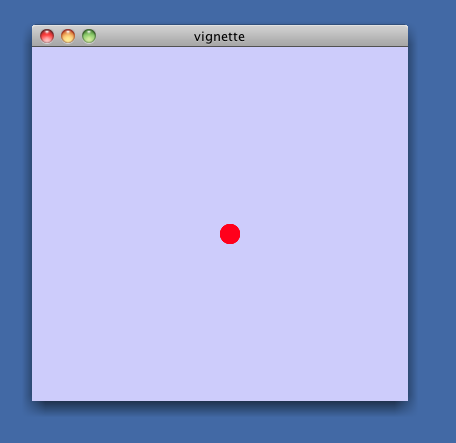
> displayGraph(cw)You should see a single red dot in the middle of a small Cytoscape window titled 'vignette' in the Cytoscape Desktop:
This graph needs layout.
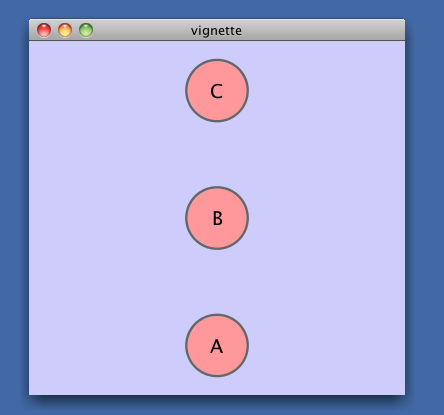
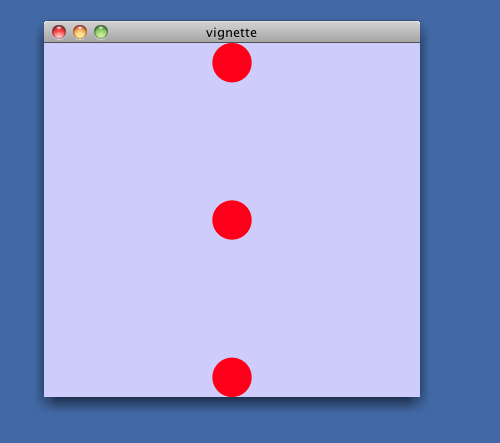
> layoutNetwork(cw, 'grid')After layout, you will see the structure of this graph: simply 3 unconnected nodes. These nodes will be unlabeled, small and colored red -- not very informative.
> redraw(cw)