RCytoscape: Tools for Molecular Cartography

RCytoscape is an R package and part of the Bioconductor
project. It fills a gap between two tools -- two computing environments -- which are each already very useful in their own right.
-
R and Bioconductor offer very powerful command-line, scripting and programming capabilities, along with a rich variety of up-to-date biological annotation. Graph and network visualization capabilities have been limited.
-
Cytoscape has become the standard network visualization tool in molecular biology. Many useful plugins are available, offering computational algorithms and rich biological data. However, Cytoscape is primarily in a "point-and-click" application, lacking strong scripting capabilities. It is easy to use, justly popular, but the lack of a strong and nuanced scripting interface limits its range of application.
RCytoscape expands the capabilities of these two computing environments by the simple technique of connecting them. The visualization (and data and algorithmic) strengths of Cytoscape are married to the statistical, annotation and general purpose programming strengths of R and Bioconductor.
RCytoscape encourages a style of data exploration and analysis which you may find useful. The contents of a
network, and all the details of its display -- colors, sizes, shapes, font size, layout -- are specified with R commands
and functions, inflected by data exactly as you wish. network visualizations of great precision and expression can be
reproducibly created, and evolved over time. Analysis and visualization can proceed hand-in-hand, creating a rich environment for exploratory data analysis.
We hope that bioinformaticians and computational biologists will find it useful: they are the
original, intended audience. But just as with Cytoscape itself, RCytoscape has no
built-in biological semantics. RCy will be useful to any one visualizing and exploring graphs and networks.
Typical Use
RCytoscape is typically used like this:
- Assemble and annotate a graph, from data, in R
- Transfer the graph to Cytoscape
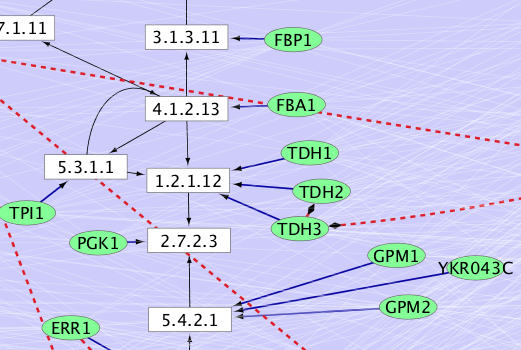
- Control the rendering of the graph from R: so that colors, shapes, opacity, and layout reflect (possibly dynamic) data and analyses.
Alternatively, for those who already have a Cytoscape network, created in any of the conventional ways, you can 'attach' to the network from R, and
gain all the power mentioned in item 3, above.

