   cy = CytoscapeConnection ()
   print (version (cy))
   hideAllPanels (cy)
   getWindowList (cy)
Please note! Any time you spend studying this example code will serve you well in all subsequent use of RCy!
# initialize
g = new ("graphNEL", edgemode = "directed")
g = initNodeAttribute (g, "nodeType", "char", "undefined")
g = initNodeAttribute (g, "label", "char", "undefined")
g = initEdgeAttribute (g, "edgeType", "char", "undefined")
# add nodes and edges
g = addNode ("A", g)
g = addNode ("B", g)
g = addNode ("C", g)
g = addEdge ("A", "B", g)
g = addEdge ("A", "C", g)
# add node and edge attribues
nodeData (g, "A", "nodeType") = "kinase"
nodeData (g, "B", "nodeType") = "substrate"
nodeData (g, 'A', 'label') = 'kinase A'
nodeData (g, 'B', 'label') = 'substrate B'
nodeData (g, 'C', 'label') = 'C'
edgeData (g, "A", "B", "edgeType") = "phosphorylates"
edgeData (g, "A", "C", "edgeType") = "binds"
# create a CytoscapeWindow, after first making sure that no prior window of the same name
# name exists already. (CytoscapeConnections are cheap; create them whenever you need them.)
cy = CytoscapeConnection ()
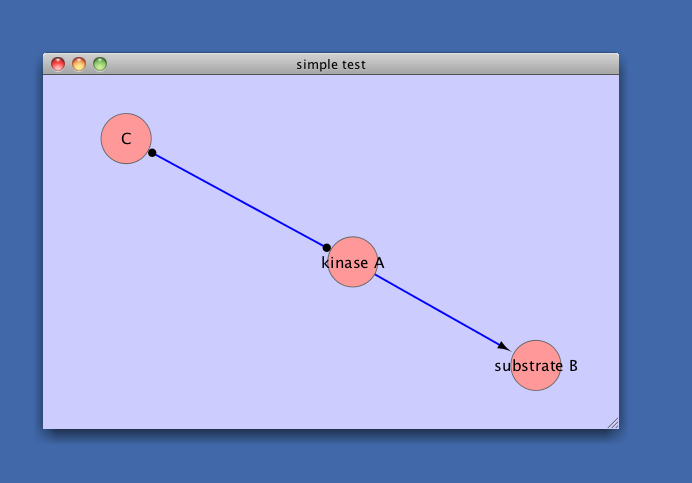
window.title = 'simple test'
if (window.title %in% as.character (getWindowList (cy)))
deleteWindow (cy, window.title)
cw = new.CytoscapeWindow (window.title, g)
# send graph to Cytoscape. this only needs to be done once!
displayGraph (cw)
# ask Cytoscape to layout the graph
layoutNetwork (cw, 'jgraph-spring')
# instruct Cytoscape to use each node's 'label' attribute as the value for the visible label it draws on the node
setNodeLabelRule (cw, 'label')
# experiment on your own, if you wish, with this occasionally useful rule
setNodeLabelRule (cw, 'nodeType')
# slighly more complicated rules. phosphorylation is a directed activity, so put an arrow only on the substrate end
# binding is reciprocal, so put a circle on both ends of that edge
setEdgeTargetArrowRule (cw, 'edgeType', c ('phosphorylates', 'binds'), c ('Arrow', 'Circle'))
setEdgeSourceArrowRule (cw, 'edgeType', c ('phosphorylates', 'binds'), c ('None', 'Circle'))
# now ask Cytoscape to redraw the graph using these rules
redraw (cw)
# set window and network sizes
setWindowSize (cw, 600, 400)
fitContent (cw)
setZoom (cw, 0.8 * getZoom (cw))
Don't hesitate to send me questions if you run into trouble: pshannon AT systemsbiology DOT org